SAS Visual Analytics Software
Company Name: SAS Institute Inc.
About: Institut Clinident SAS develops biomolecular diagnostic tools applied to oral medicines.
Headquarters: Clermont-ferrand, Auvergne, France.
SAS Visual Analytics Overview
What is SAS Visual Analytics?
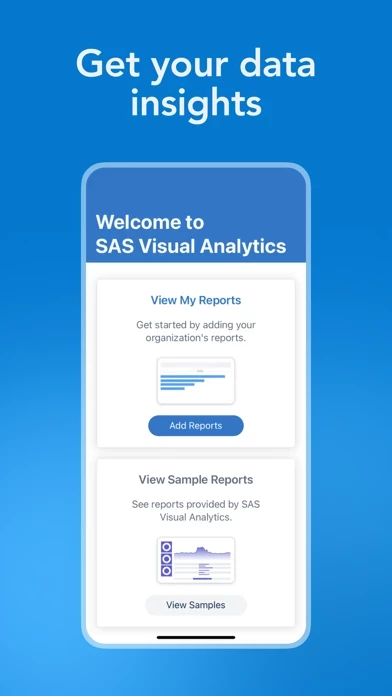
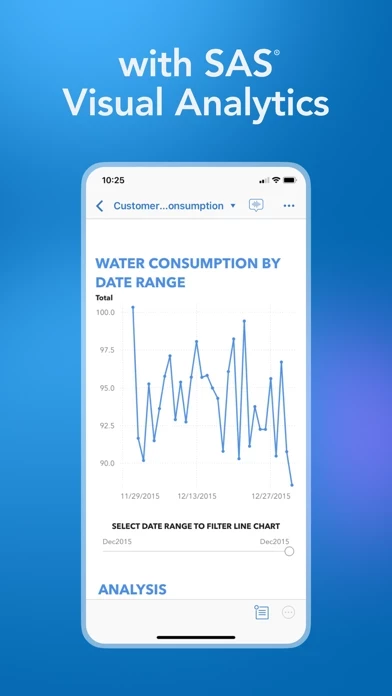
SAS Visual Analytics is a business intelligence app that allows users to view and interact with reports containing charts, graphs, tables, and other report objects. The app is designed to empower decision-makers with business reports and dashboards that can be accessed anywhere, anytime. Users can interactively explore vast amounts of data and collaborate with others via the app. The app updates the view when reports and data change, ensuring users are always up to date.
Features
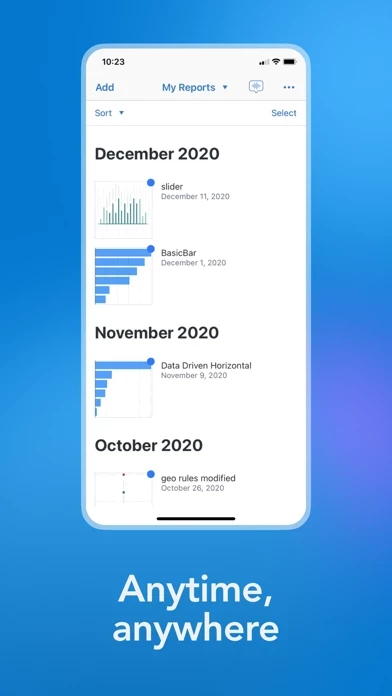
- Works with reports whether connected or not
- Interactive reports, dashboards, and graphs
- Multiple gestures, including pinch, zoom, tap, and multi-touch
- Fast response times
- Secure data access based on user role and access permissions
- Access to big data from SAS Visual Analytics
- Powered by SAS LASR Analytic Server or SAS Cloud Analytic Services (CAS)
- Compatible with SAS Visual Analytics on SAS Viya or SAS Visual Analytics 7.5 (SAS 9.5) server backend versions 8.5, 8.4, 8.3, and 7.5
- Acceptance of SAS Institute Inc. License Agreement for SAS Visual Analytics App Software is required to use the app.
Official Screenshots
Product Details and Description of
SAS® Visual Analytics empowers decision makers with business reports and dashboards anywhere, anytime! SAS® Visual Analytics App, part of the SAS Visual Analytics product family, enables you to view and interact with reports that can contain a variety of charts, graphs, gauges, tables, and other report objects. With easy-to-use multi-touch gestures, you can move through the application, filter and drill into data in the reports, and make decisions in the office, in meetings, or out on the road. Business users can interactively explore vast amounts of data and collaborate with others via the SAS Visual Analytics App. When reports and data change, the app updates the view ensuring users are always up to date. Requirements: A supported version of SAS Visual Analytics: • SAS Visual Analytics on SAS® Viya® • SAS Visual Analytics 7.5 (SAS® 9.5) SAS Visual Analytics server backend versions 8.5, 8.4, 8.3, and 7.5. Highlights: • Anywhere you go. You can work with reports whether you are connected or not. • Interactive reports, dashboards and graphs. A variety of reports, dashboards, graphs, and gauges provide the customization and flexibility you need to meet your wide range of business demands. • Multiple gestures. You can use familiar gestures, including pinch, zoom, tap, and multi-touch. • Fast. Just as you’d expect – the application provides great response times and a fantastic experience while you work with your reports. • Secure. Data access is based on user role and access permissions. • Access to big data. You have the ability to access big data from SAS Visual Analytics. Release 7.5 is powered by SAS® LASR(TM) Analytic Server. Release 8.3 and later, on SAS Viya, are powered by SAS® Cloud Analytic Services (CAS). License Agreement: Your use of this application indicates your acceptance of the terms of the SAS Institute Inc. License Agreement for SAS® Visual Analytics App Software, linked to below. If you do not agree with these terms, you are not authorized to use the application.
Top Reviews
By TejAces
Awesome app
I love it! The graphs are very well done, intuitive, and easy to use!
By Mikepage
New release crashes as soon a you try to open a report
App has worked great until last release. Now it immediately crashes. I hope a fix is on the way.