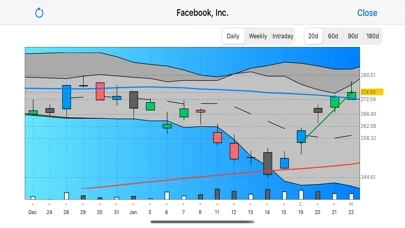
Candlestick Charting Overview
These patterns tightly integrated with some of the most highly respected technical indicators, provides the tools you need to help you spot trend reversals quickly and easily, focusing your attention on "high probability" market signals.
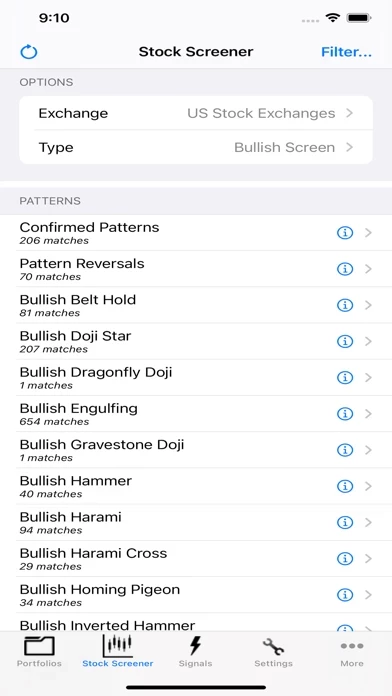
* Screens - Stock Screener which integrates many highly respected technical indicators with time-tested candlestick patterns so you have a definite edge in your search for good quality stocks.
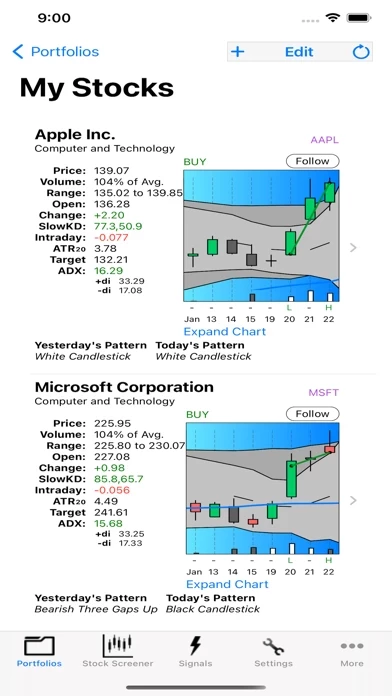
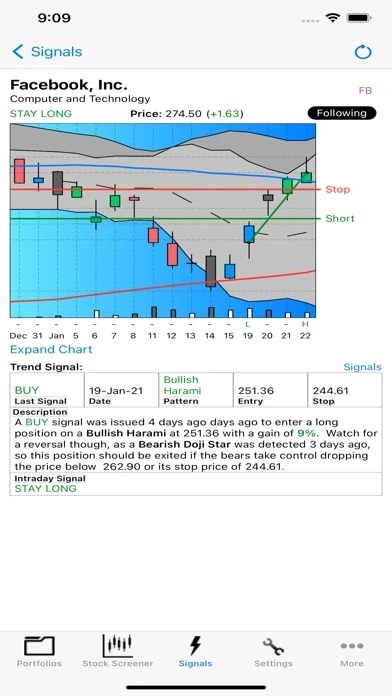
Official Screenshots
Product Details and Description of
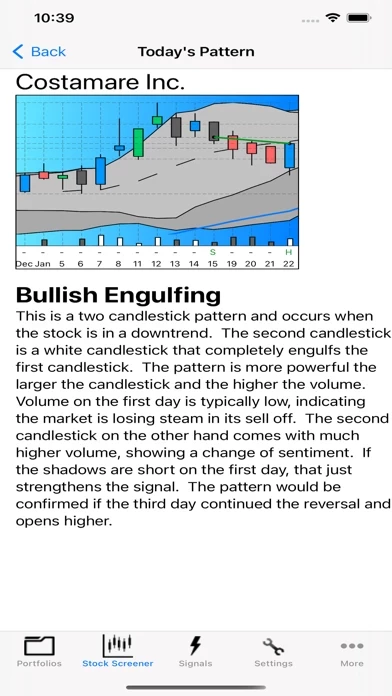
This App, Candlestick Charting integrated with Technical Analysis, gives you the tools you need to help you become a successful trader. It provides the following benefits to help you in your trading plan: * Candlestick Patterns - Detects more than 70 of the most widely recognizable candlestick patterns providing key patterns for trend reversals. * Supports Equities, Commodities and FOREX. * Screens - Stock Screener which integrates many highly respected technical indicators with time-tested candlestick patterns so you have a definite edge in your search for good quality stocks. * Trending Indicators - Detects strong trending stocks and helps traders profit by taking chunks out of the middle of important trends (ADX) * Directional Indicators - Detects when buying overtakes selling and the tide has changed course (ADX, +-DI) * Stop and Reverse Indicators - Detects trend reversals (PSAR, Volatility Stops) * Momentum Indicators - Detect overbought and oversold levels of a stock (Slow Stochastics) * Volume Indicators - Detects the force behind these moves (Volume, Intraday Intensity) * Moving Average Indicators - Helps traders understand key support/resistance levels (MA, EMA, Bollinger Bands, ATR Bands) Setup a watch list of your favorite trading stocks. Monitor these stocks as this App automatically detects new patterns and signals. See patterns as they develop throughout the day real-time, used either as confirmation of a previous day's pattern or as a key to spotting a new patterns develop. These patterns tightly integrated with some of the most highly respected technical indicators, provides the tools you need to help you spot trend reversals quickly and easily, focusing your attention on "high probability" market signals. The visual display of bearish and bullish sentiment will help you towards understanding the emotional dynamic, to help gain insight into whether the trend will reverse or continue, with the ultimate goal of earning a higher rate of return on your investments. This app supports a "free" and "paid" version of the application. The free version limits the # of portfolios you can create, symbols tracked/followed, screens available, and technicals that can be applied to the charts. You can subscribe using in-app purchases to remove these limitations. Disclaimer Buy/selling securities is inherit with risk and you assume all responsibilities associated with this risk. The information drawn and analysis provided is believed to be reliable but in no way is guaranteed. You assume all risk associated with using the data provided herein and in no way can the developer of this App assume any liability.
Top Reviews
By Bakanook
Extremely informative
I’m an avid trader, no expert by any means, with success mostly by luck and following trends, however this app has given me so much insight into why those trends were successful just by reading the meaning of each pattern and then reviewing the real time data I have been able to strategically buy call options that have consistently been successful especially with lesser known stocks on the market. Kudos to the developer for taking the time to develop such an extremely informative app. M
By pobrecitoshame
Great app could be greater...
This is the best mobile app for a new trader/investor like myself. The charts, education, and interaction with other investing tools and knowledge is the best I have found. If there is one drawback it is that the stock screener isn’t as customizable as I’d like, which makes it difficult to find stocks that match the criteria I need. But it is a mobile app so of course you expect some limitations. Still, each time I use it, it is helping me learn more and more about being a profitable trader.
By AaronN7
Very useful
I’m pretty new to stock trading. This app is great for gaining insights into patterns. I look at what the name of the pattern for the day is and then do further research on what it means. It’s also great for looking at historical trends. I don’t understand why some people are saying they can’t view the charts or that you can’t do anything without paying. I’m currently tracking three stocks for free. I’m considering subscribing.