ConnectStats Reviews
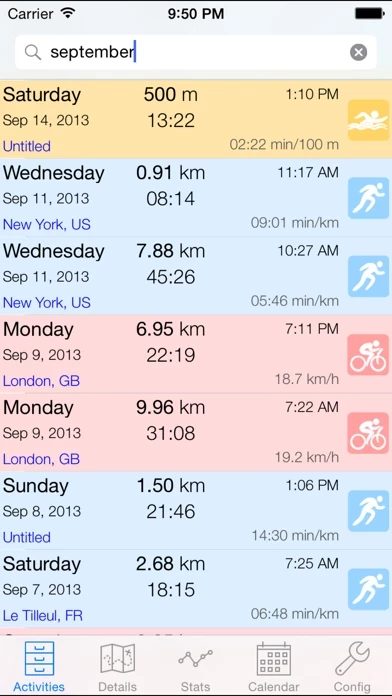
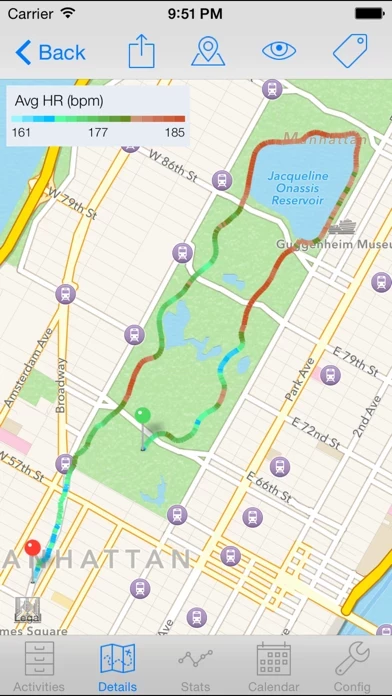
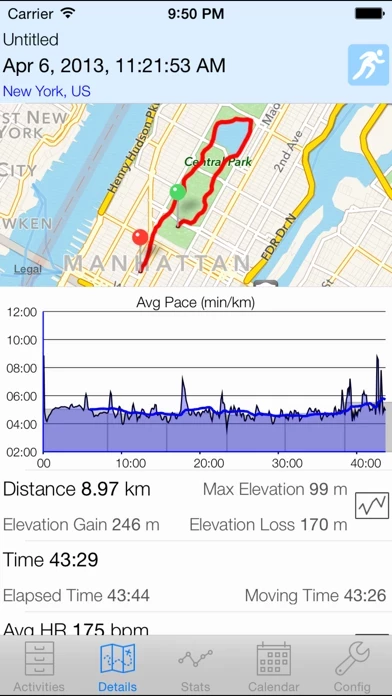
Published by Brice Rosenzweig on 2026-02-21🏷️ About: Connect Stats is an activity viewer app that allows users to view and analyze their activities from Garmin Connect or Strava. The app provides detailed reports, statistics, and graphs on all the data collected from the user's iPhone or iPad. It also supports multiple Garmin Connect accounts and most activity types, including lap swimming, skiing, running, biking, and more. The app is regularly updated and open source.