Analytics Pro 2 Overview
New features, new reports and a new design make viewing your Google Analytics™ data easier, faster and more enjoyable than ever.
● Event Categories, Actions and Labels, with drill a down option to refine your analysis.
● Create custom reports with manually set dimensions and metrics.
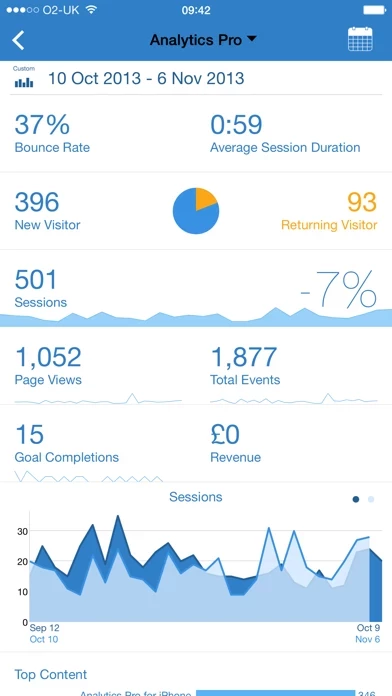
● Summary Reports for Today, Yesterday or a Preset or custom date Range.
11 Content reports to understand interactions with website content.
Official Screenshots

Product Details and Description of
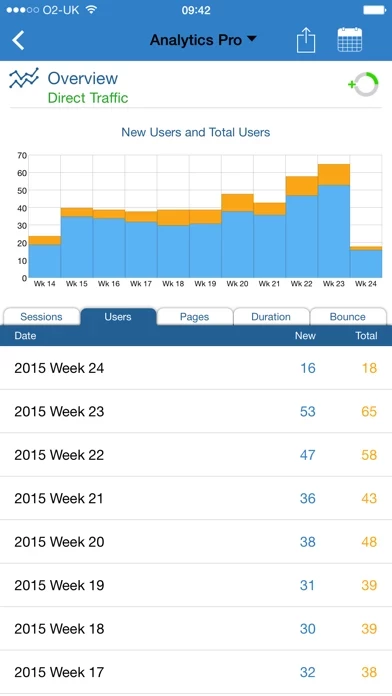
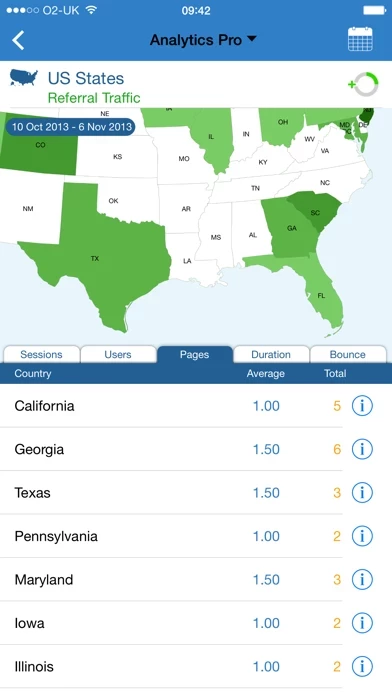
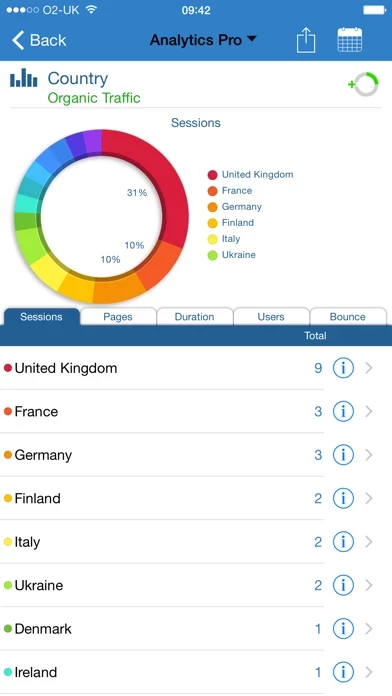
Analytics Pro 2 is here. New features, new reports and a new design make viewing your Google Analytics™ data easier, faster and more enjoyable than ever. Contact Us via our Website if you have any questions. Highlights: ● Create custom reports with manually set dimensions and metrics. 3 report types allow limited analysis options. ● Multiple Accounts and Profiles ● Day, Week, and Month dimensions to monitor trends ● Print Preview to configure reports before Printing with AirPrint or Exporting as PDF ● Portrait and Landscape Graphs & Maps ● Drill Down through your data Reports: ● More than 175 drill-down combinations allow deep insight into your data ● 65 Reports organized into 8 sections ● Customize the Reports Menu by selecting Favorites ● Website Previews help associate the reports with the website Segments ● Isolate and examine subsets of your data with Segments ● Select the segment you are interested in and the report will filter the data for the selected segment SUMMARY ● The Summary and Dashboard reports provides a snapshot of user activity in 9 sections ● View reports for Today, Yesterday or a custom date range DASHBOARD ● The Dashboard report gives you a snapshot of recent user activity presented visually with graphs and charts ● View reports for Today, Yesterday or for custom date range ● Some of the graphs are interactive, so that you can make comparisons, view the underlying data and toggle numeric/percentage values AUDIENCE 20 Audience reports to understand your users: ● The Overview report shows Daily and Hourly trends ● The Countries, US States & City reports visually explore visitor location using maps - Pan and Zoom function enabling you to easily visualise where your users are coming from - Drill down on a location, such as country or city etc. to view daily, hourly, weekly or monthly trends ● The New City Map Report displays user location on world map ● The Location Report can be filtered by Continent, Sub-Continent, Country, Region & City ● Language ● Visitor Loyalty ● Browser, Browser Version and Operating System ● Screen Colors & Resolution ● The Device report identifies which sessions are from mobile, tablet and desktop devices ● Network Domain and Location ● Hostname ● Flash and Java Support ● Age Bracket ● Gender ● Interest TRAFFIC SOURCES ● Traffic Sources show where your users come from, including links that display the actual web page that your users came from ● Search Keywords ● Adwords Campaigns ● Keyword Positions ● Campaign Performance shows Daily Trend Graph for CPM/CPC, CTR, Ad Cost, Impressions & adClicks ● Ad Versions summarises Ad Content for each Campaign SOCIAL ● Monitor how users arrive at your website via a Social Network referral ● Data Hub Activity reports the activities where content is shared or mentioned on a social data hub ● Monitor Social Actions by Entity and Source CONTENT 11 Content reports to understand interactions with website content. ● Top Content ● Top Content By Title ● Top Landing Pages ● Top Exit Pages. ● Site Search Keywords ● Site Search Categories ● Event Categories, Actions and Labels, with drill a down option to refine your analysis. ● Event Trending with daily trend of Events. Select a date to drill down for the selected day. ● Site Speed report GOALS ● Goal Starts ● Goal Completions ● Goal Value ● Goal Flow E-COMMERCE ● Summary Reports for Today, Yesterday or a Preset or custom date Range. ● Transactions Report with drill down to see the Transactions and Purchases for any day. Includes Quantity, Revenue, Tax, Shipping and Conversion Rate Metrics. ● Revenue ● Products ● Product SKU ● Product Categories. APP TRACKING 5 App Tracking reports to display App analytics data ● App Name and Version ● Screen Name ● Landing Screen ● Exit Screen Name ● Crashes & Exceptions report. You must have a Google Account with Google Analytics™ to use this App. To contact us or to find out more, visit www.blackburninternet.com/this app/
Top Reviews
By LifeInLoFi
Easy access to essential stats
I use this app daily to check how my websites are performing. All the important stats are only a couple of taps away. Another tap or two on the dashboard to drill down for deeper analytics. I greatly prefer this to the official Analytics app. This is an essential tool to help me manage my clients’ websites.
By Hermanstik
By far best analytics app!
I've tried and given just about every analytics app a fare shake, of the analytics apps I've used over the last 4 years Analytics Pro 2 blows them away. I used the first version of this app on and off "four times a month" for the past year or so, I use the new version " Pro 2" everyday, because it's intuitive easy to use most of all provides an easy way to export highly useful reports to my clients.
By Applesdad
Must Buy, best google analytics app
At first I was skeptical to buy this app because there were so few reviews and but it is worth every cent. User Interface is beautiful, simple and there are tons of reports. On top of being a great app the support is just as great. I had a question about how to export the reports and the developer responded within minutes. Don't hesitate buy this app.