Analytics Pro 2 Übersicht
New features, new reports and a new design make viewing your Google Analytics™ data easier, faster and more enjoyable than ever.
● Event Categories, Actions and Labels, with drill a down option to refine your analysis.
● Create custom reports with manually set dimensions and metrics.
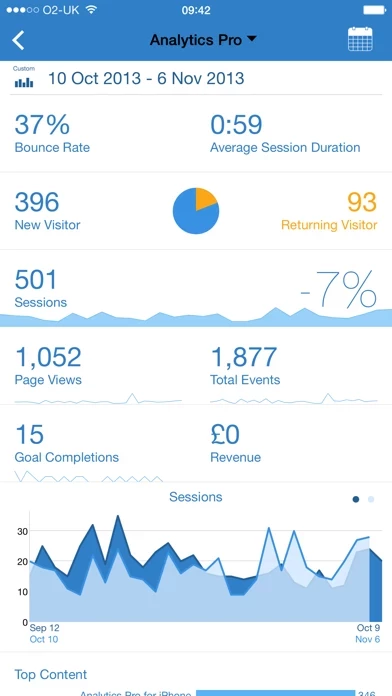
● Summary Reports for Today, Yesterday or a Preset or custom date Range.
11 Content reports to understand interactions with website content.
Offizielle Bildschirmfotos

Produkt einzelheiten und Beschreibung von
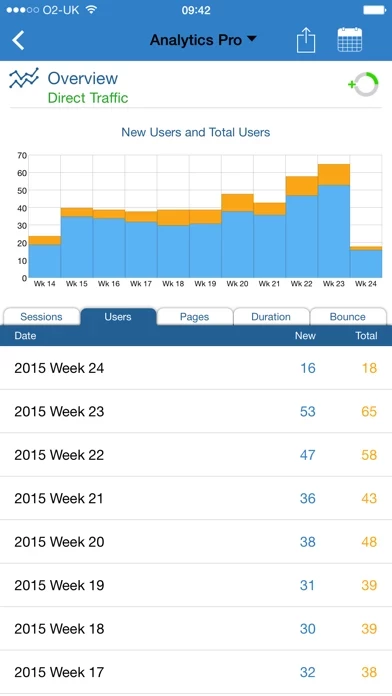
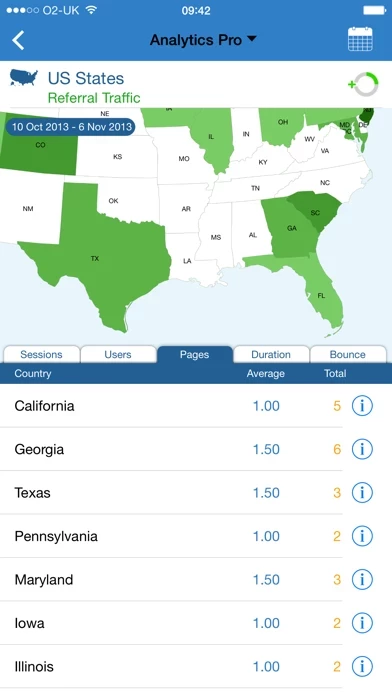
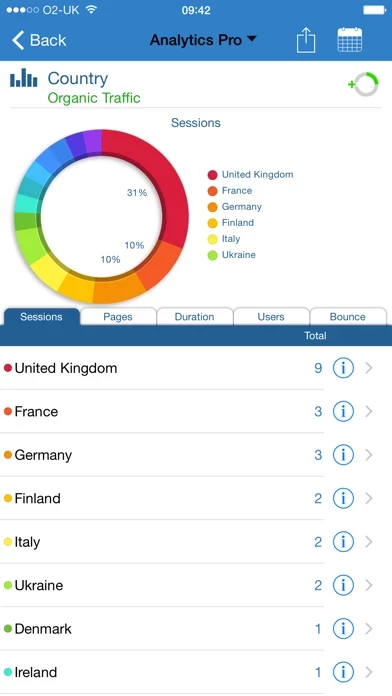
Analytics Pro 2 is here. New features, new reports and a new design make viewing your Google Analytics™ data easier, faster and more enjoyable than ever. Contact Us via our Website if you have any questions. Highlights: ● Create custom reports with manually set dimensions and metrics. 3 report types allow limited analysis options. ● Multiple Accounts and Profiles ● Day, Week, and Month dimensions to monitor trends ● Print Preview to configure reports before Printing with AirPrint or Exporting as PDF ● Portrait and Landscape Graphs & Maps ● Drill Down through your data Reports: ● More than 175 drill-down combinations allow deep insight into your data ● 65 Reports organized into 8 sections ● Customize the Reports Menu by selecting Favorites ● Website Previews help associate the reports with the website Segments ● Isolate and examine subsets of your data with Segments ● Select the segment you are interested in and the report will filter the data for the selected segment SUMMARY ● The Summary and Dashboard reports provides a snapshot of user activity in 9 sections ● View reports for Today, Yesterday or a custom date range DASHBOARD ● The Dashboard report gives you a snapshot of recent user activity presented visually with graphs and charts ● View reports for Today, Yesterday or for custom date range ● Some of the graphs are interactive, so that you can make comparisons, view the underlying data and toggle numeric/percentage values AUDIENCE 20 Audience reports to understand your users: ● The Overview report shows Daily and Hourly trends ● The Countries, US States & City reports visually explore visitor location using maps - Pan and Zoom function enabling you to easily visualise where your users are coming from - Drill down on a location, such as country or city etc. to view daily, hourly, weekly or monthly trends ● The New City Map Report displays user location on world map ● The Location Report can be filtered by Continent, Sub-Continent, Country, Region & City ● Language ● Visitor Loyalty ● Browser, Browser Version and Operating System ● Screen Colors & Resolution ● The Device report identifies which sessions are from mobile, tablet and desktop devices ● Network Domain and Location ● Hostname ● Flash and Java Support ● Age Bracket ● Gender ● Interest TRAFFIC SOURCES ● Traffic Sources show where your users come from, including links that display the actual web page that your users came from ● Search Keywords ● Adwords Campaigns ● Keyword Positions ● Campaign Performance shows Daily Trend Graph for CPM/CPC, CTR, Ad Cost, Impressions & adClicks ● Ad Versions summarises Ad Content for each Campaign SOCIAL ● Monitor how users arrive at your website via a Social Network referral ● Data Hub Activity reports the activities where content is shared or mentioned on a social data hub ● Monitor Social Actions by Entity and Source CONTENT 11 Content reports to understand interactions with website content. ● Top Content ● Top Content By Title ● Top Landing Pages ● Top Exit Pages. ● Site Search Keywords ● Site Search Categories ● Event Categories, Actions and Labels, with drill a down option to refine your analysis. ● Event Trending with daily trend of Events. Select a date to drill down for the selected day. ● Site Speed report GOALS ● Goal Starts ● Goal Completions ● Goal Value ● Goal Flow E-COMMERCE ● Summary Reports for Today, Yesterday or a Preset or custom date Range. ● Transactions Report with drill down to see the Transactions and Purchases for any day. Includes Quantity, Revenue, Tax, Shipping and Conversion Rate Metrics. ● Revenue ● Products ● Product SKU ● Product Categories. APP TRACKING 5 App Tracking reports to display App analytics data ● App Name and Version ● Screen Name ● Landing Screen ● Exit Screen Name ● Crashes & Exceptions report. You must have a Google Account with Google Analytics™ to use this App. To contact us or to find out more, visit www.blackburninternet.com/diese App/
Oben Erfahrungen und Bewertung
durch Randomkayne
Super
Erste App schon gekauft = super. Die aktuelle Version ist noch besser. Sehr schnell und sehr gut bedienbar 😀👍
durch DanSaw
Super übersichtliche App
+Design +Funktionen =empfehlenswert
durch Enthusiast824
Gute App
Gut, weiter so!


![Software Flashlight Pro [Multipurpose LED light]](https://is1-ssl.mzstatic.com/image/thumb/Purple5/v4/95/c7/8d/95c78d33-74e9-b2e8-5c3d-5137cd0b4124/source/200x200bb.jpg)