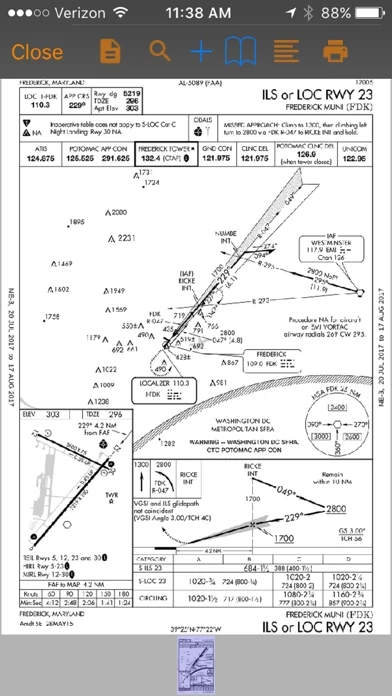
AOPA GO is a convenient pre-flight planning tool, allowing pilots to search the industry’s most comprehensive airport directory; create, edit and file flight plans; and check a diverse gallery of aviation weather charts.
Built on the same powerful Jeppesen flight planning engine as the AOPA Flight Planner, the app allows you create, edit, and file flight plans and get a weather briefing using CSRA DUATS or Leidos Flight Service.
Available exclusively to AOPA members, AOPA GO delivers essential flight planning tools—AOPA Airports Directory, AOPA Weather and a select set of AOPA Flight Planning features in the palm of your hand.
With information and images from Jeppesen, Aviation Digital Data Service (ADDS), and the National Oceanic and Atmospheric Administration (NOAA), pilots get a complete picture of the weather that could affect their flight.
Best of all, AOPA GO syncs all pilot information, aircraft profiles, flight plans, and user waypoints with the AOPA Flight Planner.
No matter if you are creating a new flight plan from scratch, or pulling up a saved route to file for flight, AOPA GO has you covered.
AOPA GO Weather is designed to provide “best of breed” aviation weather information by compiling the best sources available into one resource.
Users of the AOPA Flight Planner can also include any of their saved user-defined waypoints in a flight plan.
You can also see current and forecast weather conditions along your route of flight using the Route Weather feature.
Whether you plan your flight at your desk or on the ramp, you’re covered with AOPA.
Quickly review the METARs and TAFs closest to your location right on the main Weather screen, or choose from a gallery of national or regional weather chart images.
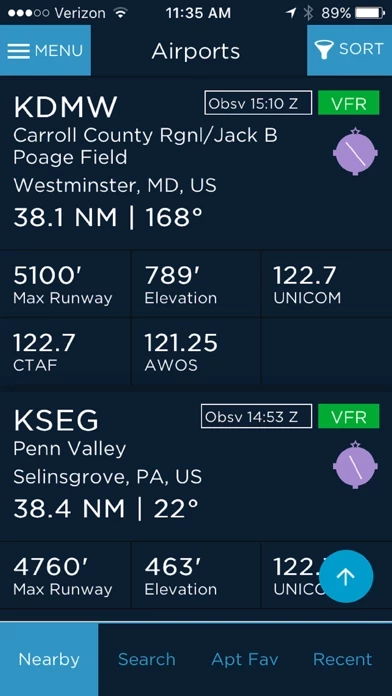
AOPA GO uses your device’s physical location to identify the nearest airports, heliports, and seaplane bases.
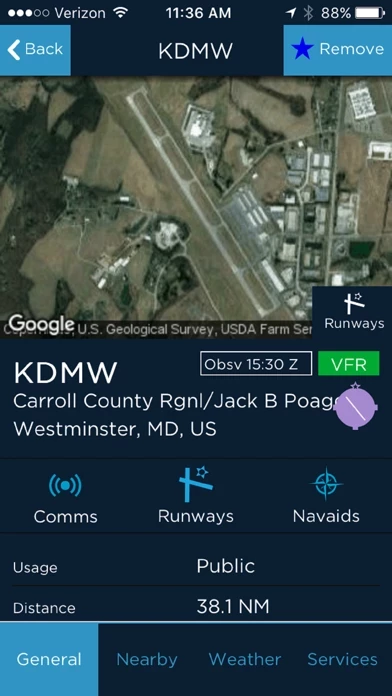
All the information you need about an airport is readily available—from communications and operations to fuel providers and other services available on the field and nearby.
Adverse weather conditions are color-coded based on severity to be more noticeable on METAR and TAF reports.