It provides an easy way to check in on the actions you're tracking and then displays your progress in a calendar grid, making it easy to see patterns and potential areas for improvement.
All visualizations for actions with amounts, of course, will adjust and take into account values that you enter: the grid will highlight cells with larger amounts and breakdown charts will also be amount-based instead of just counting the number of check-ins.
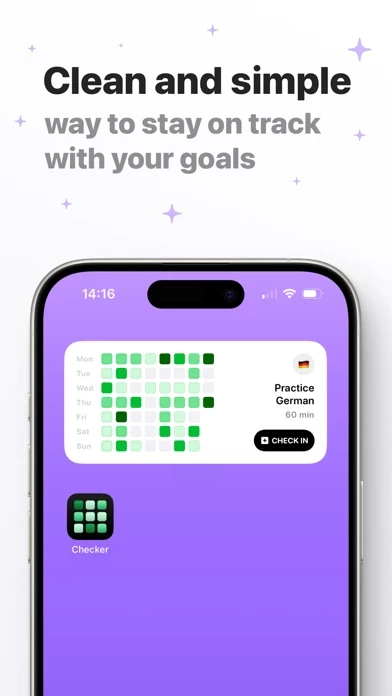
The widget shows the grid, the name of the action you're tracking, as well the time of your last check-in or the current amount value for the day.
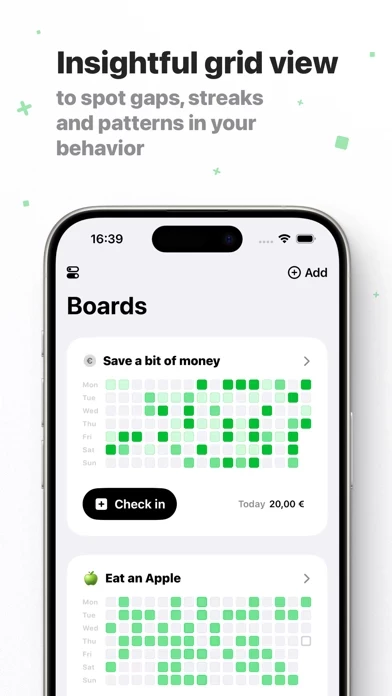
For every action you're tracking, this view gives you a way to look at your progress in a more condensed format.
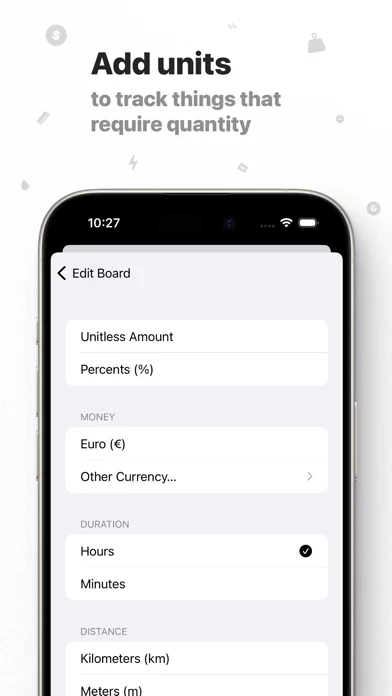
It tracks either the number of times you check in or a specific amount (time, distance, calories, money, etc.) depending on your preference.
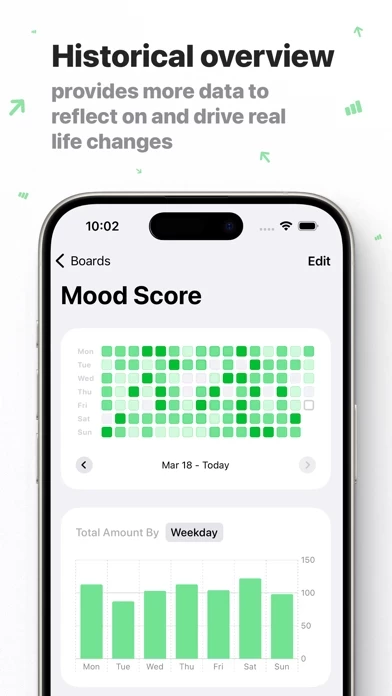
You'll see which day of the week or which month contributed the most to the overall progress, which again, gives you an insight and might prompt real-life changes.
For example, you can track how much time you spent on your goal, how much money you saved or spent, or anything that requires distance, mass, calories and more.
Over time you'll be able to see patterns on the grid: days when you're making a lot of progress and days when you're falling behind.
It gives you a bird's-eye view of your progress, it's purely visual and intuitive.
This gives you an option to add a value and a unit to the action you're tracking.
Interactive Home Screen widgets keep important goals always in sight and let you check in withough even opening the app.
This gives you data to adjust things in real life and improve.
I truly hope you enjoy using that app and that it will help you achieve your goals or change your life for the better, just as it has already helped me.
Each cell of the grid changes color depending on your activity on a specific day.