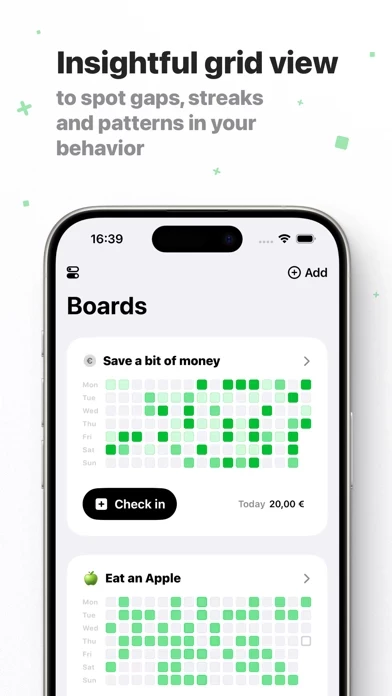
It provides an easy way to check in on the actions you're tracking and then displays your progress in a calendar grid, making it easy to see patterns and potential areas for improvement.
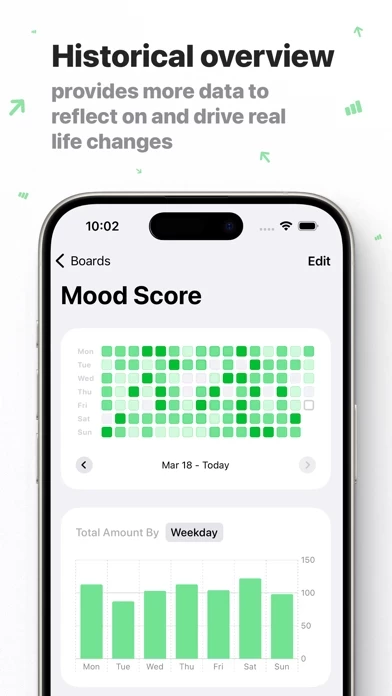
All visualizations for actions with amounts, of course, will adjust and take into account values that you enter: the grid will highlight cells with larger amounts and breakdown charts will also be amount-based instead of just counting the number of check-ins.
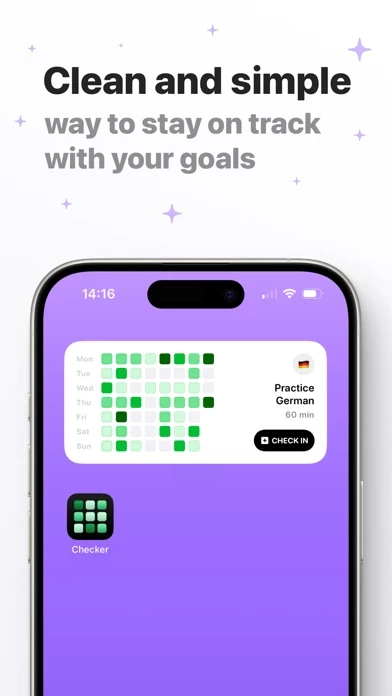
The widget shows the grid, the name of the action you're tracking, as well the time of your last check-in or the current amount value for the day.
For every action you're tracking, this view gives you a way to look at your progress in a more condensed format.
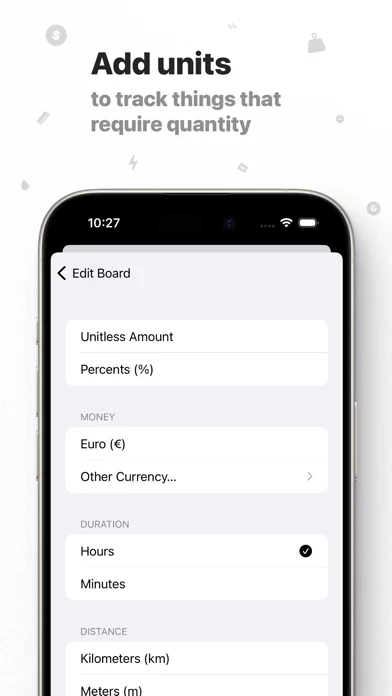
It tracks either the number of times you check in or a specific amount (time, distance, calories, money, etc.) depending on your preference.