ReportPlus Data Analytics Reviews

ReportPlus Data Analytics Reviews

Published by

About: ReportPlus is a true self-service BI tool for your business that allows you to
securely access and transform your data to gain new insights and make smarter
decisions faster. Become empowered to easily create, edit and share interactive
real-time insights and KPIs providing an effective data-driven approach that
every business needs on any platform to stay on top of your organization.


About ReportPlus Data Analytics


Become empowered to easily create, edit and share interactive real-time insights and KPIs providing an effective data-driven approach that every business needs on any platform to stay on top of your organization.

ReportPlus is a true self-service BI tool for your business that allows you to securely access and transform your data to gain new insights and make smarter decisions faster.

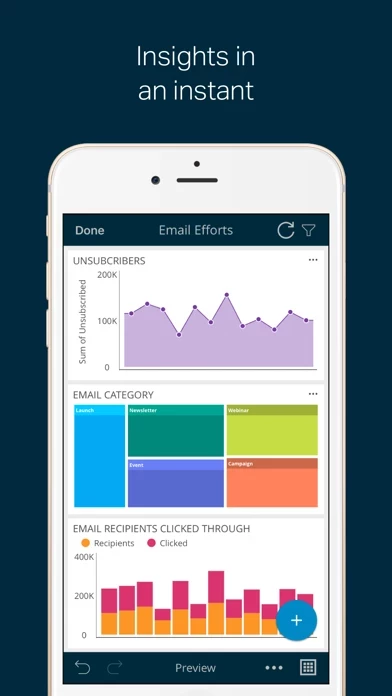
• Create interactive charts and dashboards that can be filtered, sorted, drill down into data, link dashboards.

• New to ReportPlus? Download the app, create two free dashboards.

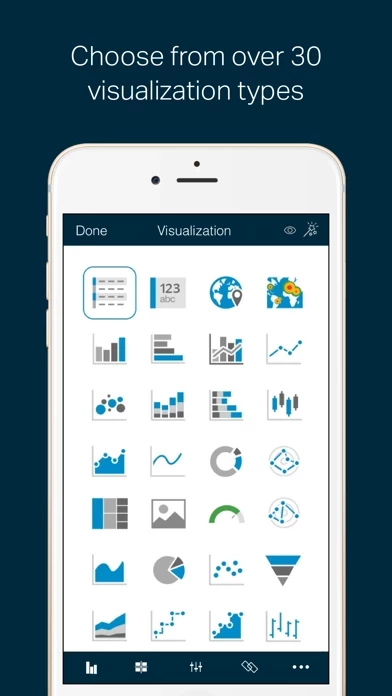
• Choose from 23 different visualization types including bar, column, donut, area, stacked, bubble, and pie charts, maps, tables, KPI gauges, and many more.

Your subscription can be managed in your iTunes Account Settings after purchase.

Payments will be charged to your credit card through your iTunes account after confirmation of purchase.

The ReportPlus subscription is optional, and the subscription features are available via an auto-renewing subscription.

• Already use ReportPlus? Download the app for FREE and sign-in with your ReportPlus account.

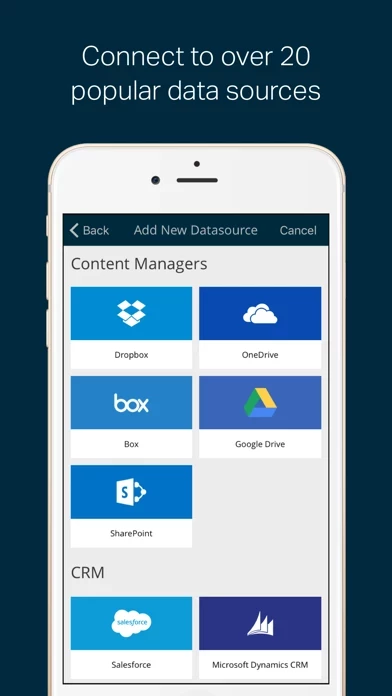
• Datastores: SQL Server, Analysis Services, SSRS, MySQL, Oracle, Sybase, PostgreSQL, Hadoop Hive.

Your subscription will automatically renew unless cancelled at least 24-hours before the end of the current period.

• Nail your next presentation by exporting your dashboards and charts to PPT, PDF, and Word with your branding.

• Many more: OData service, IMAP Mail Server, User Voice, Web Resource.

No credit card required, and no obligation to purchase.


Overall User Satisfaction Rating


Negative experience
60.6%

Positive experience
39.4%

Neutral
14.2%

~ from Justuseapp.com NLP analysis of 121 combined software reviews.

0 ReportPlus Data Analytics Reviews

4.5 out of 5

See 15 more Reviews


Awesome App - a few minor bugs

Currently using free version and am using this to access a ShipWorks SQL database remotely using OpenVPN. Am on the verge of subscribing it is that impressive so far. Why this great app doesn’t have more reviews, I’m not sure. Before I critique few bugS, please understand I recommend trying this program out. Quite powerful and sophisticated for iOS App IMO. BUGS so far: There are some things to be aware of when working with a larger DB. There is a 200K limit, so it is best to HIDE ALL fields, then make your needed fields visible. ReportPlusDataAnalytics defaults to all fields being visible which created some issues showing data until I figured it out. Also using some sort of Sort field, like Date, then SETTING A shorter time period also got data under 200k record limit. Couple of glitches occur sometimes when switching between different graphs, where nothing is displayed. Be sure to hit the # area of the pivot table to switch views between table and graph. Also, resizing field columns does not always seem to remain where I set them. Overall a great app with a bit of a learning curve to figure out and also knowing how to connect to your DB is required.


Works for me

Works as indicated and user friendly


bee pig

Cool!


Great App!

This is an amazing little app. I originally bought it with the hope that I could use it to explore CPG data sets I received from clients, but because I was dealing with 50k+ rows of data pretty regularly, it wasn't a feasible solution, and so i didn't spend any time learning the features. I have since changed jobs, and now I'm dealing with data sets more in the realm of 5k to 10k lines. After a little bit of frustration (couldn't figure out how to re-size columns...stupid, I know), I got passed my initial problems and have discovered the "page binding" feature which is very cool. Basically, page binding allows you to join source tables by common fields and filter reporting results from multiple data sources on the fly. For someone looking for mobile bi reporting on a sub-Tableau budget, this is a powerful solution.

A quick background on how I am currently using Report Plus:

I have "reports" that automatically run on an hourly basis that dump xls files to my google drive with sales figures, inventory figures, and other key metrics like product attributes for both finished goods and WIP items. Since I can use the google drive xls files as data sources for the reports, I can just refresh the Report Plus reports and new data is pulled in that is, at most, an hour behind real-time.

So far, I'm loving ReportPlusDataAnalytics, and I think with a little bit of creative use, it has tremendous reporting potential within my organization. Enjoy!

Awesome Dashboard

I have been using ReportPlusDataAnalytics over the past 2 month. As much as I liked it, I was disappointed that you could not just refresh data on a local file. And was I surprise with the latest update, NOW YOU CAN. This is really a great app for anyone who needs to give regular reports on data. The ability do quickly creat nice looking charts, graphs, trend lines etc is amazing. Then to top it off you export it in to a very nice slide presentation. The one thing I would like to see is the ability to put your own logo on the slide template. It has the ReportPlus Pro logo, (not bad but for a presentation you want your own logo). There are way to many details to review here with ReportPlusDataAnalytics, but it has been well thought out, and includes about anything you need for creating a dashboard. And to top this off the support is outstanding. Quick turn around time to email and actually help you. Look no more if you need to creat dashboards for reports. Great app!!!!!!


Awesome App

ReportPlusDataAnalytics is an incredibly powerful and versatile tool for drawing together data from a variety of sources and displaying it in a meaningful manner. Thus far I have used it with several .csv files exported from our corporate BI software as well as a large number of SharePoint lists and continue to be impressed with how well it works. The description of ReportPlusDataAnalytics as a self-service BI solution is absolutely correct and I couldn't be more pleased.

Immediately after purchasing ReportPlusDataAnalytics I contacted support for help with a minor issue related to our implementation and they have been very helpful and professional in reaching a resolution. I have nothing but the highest praise for the service we have received thus far. Many thanks!


Stellar Technical Support

Our company purchased ReportPlus for senior management to share dashboards. ReportPlusDataAnalytics creates dashboards with various chart types and options. We studied ReportPlusDataAnalytics Store to find such an app and found dashboard to be the best out of all available options. We encountered a few technical issues at the beginning and was pleasantly surprised to find Infragistics technical staff to be super responsive and very cooperative. They went out of their way to resolve the issues we faced. We highly recommend ReportPlusDataAnalytics and the technical team behind this developer to organizations who want to report their performance on mobile devices.


Provides vital real time windows into SharePoint lists for me.

I am finding the dashboard windows that I am able to create with ReportPlus let me see and manage SharePoint lists, (and people) improving the utility and benefit of that information to my work product.

It's great to pull out the iPad in the middle of a meeting and update the boss. Or print and email a report... Or just view help me manage my teams data and tasks.

I enjoy the apple type (easy) interface provided for the creation of the graphics, and had a very good experience with customer support when I needed it.

Thank you for a good solid product.


love it but...

Absolutely love this and still cannot believe this is possible to do on an Ipad. Unfortunately, I have one strange issue currently that is severely limiting my ability to use ReportPlusDataAnalytics. ReportPlus Lite allows Office365 Sharepoint Online access beautifully and multiple data sources. However, this paid version offers less data source options and the Office 365 authentication fails. I hope they resolve this very very soon.


Great App

I love ReportPlusDataAnalytics, it is easy to use, and great for business reporting. The dashboards are great for looking at multiple graphs relating to the same item so you can see the whole puzzle rather then just the pieces. I recommend ReportPlusDataAnalytics for any business executive. My only criticism is the limited compatibility with your PC.


I'm glad I purchased this

Really nice app. The look and feel is great.

Gabriel did a great job with my support request. Very thorough and timely response.

The full feature set requires a subscription but it's totally worth it. Would purchase again.


Great BI tool in your pocket

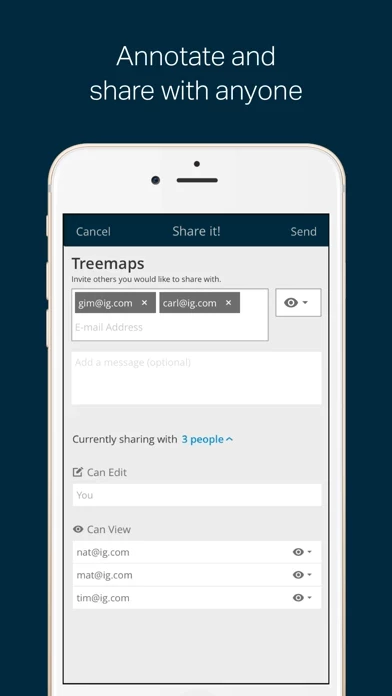
ReportPlusDataAnalytics is a great tool for an easy creation of several dashboards and data presentation. Easy to share dashboards between users using the cloud service or using your enterprise infrastructure.


Focus where required!

This tool is a great way to get your team focused on the areas that need their attention. It provides an easy-to-use methodology for the generation of those dynamic driving dashboards that inform the team in a simple and fresh way. Give it a try!


Labeling for bar chart broken in this version

They decided to change how bar charts are drawn, and now the labels for each column only show up if you have just a few columns or if you make the chart huge. Otherwise, all you get are useless unlabeled bar charts that could mean anything. Why they thought this was an improvement is bewildering. Perhaps it is a bug that will be fixed shortly.


Powerful

I've only used it for a couple hours and can see that it has SERIOUS potential as a legitimate extension of our existing BI solution.

Would like to see the maps support postal codes, cities, states, counties, etc. in the US instead of only long / lat.


Is ReportPlus Data Analytics Safe?


Yes. ReportPlus Data Analytics is quiet safe to use but use with caution. This is based on our NLP (Natural language processing) analysis of over 121 User Reviews sourced from the Appstore and the appstore cumulative rating of 4.5/5 . Justuseapp Safety Score for ReportPlus Data Analytics Is 39.4/100.


Is ReportPlus Data Analytics Legit?


Yes. ReportPlus Data Analytics is legit, but not 100% legit to us. This conclusion was arrived at by running over 121 ReportPlus Data Analytics User Reviews through our NLP machine learning process to determine if users believe the app is legitimate or not. Based on this, Justuseapp Legitimacy Score for ReportPlus Data Analytics Is 53.6/100..


Is ReportPlus Data Analytics not working?


ReportPlus Data Analytics works most of the time. If it is not working for you, we recommend you excersise some patience and retry later or Contact Support.


How was your experience with ReportPlus Data Analytics? Post a Review

Leave a comment:


Alternatives