Electricity Maps Présentation
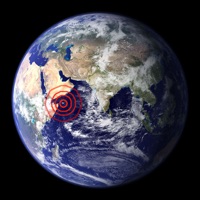
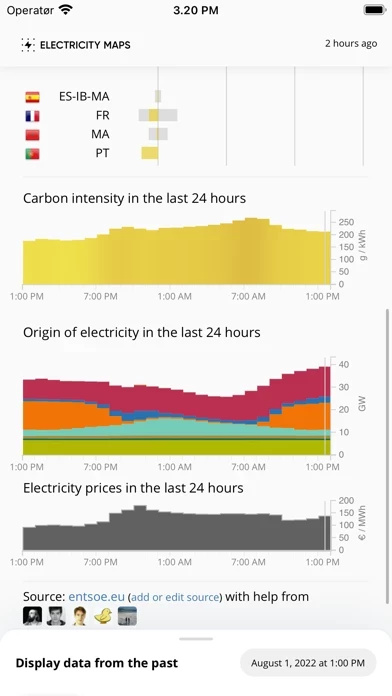
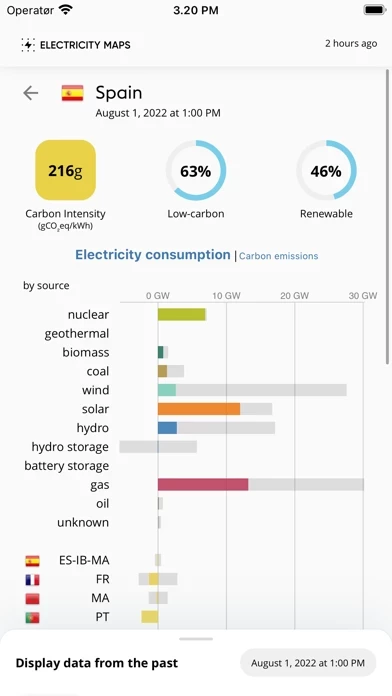
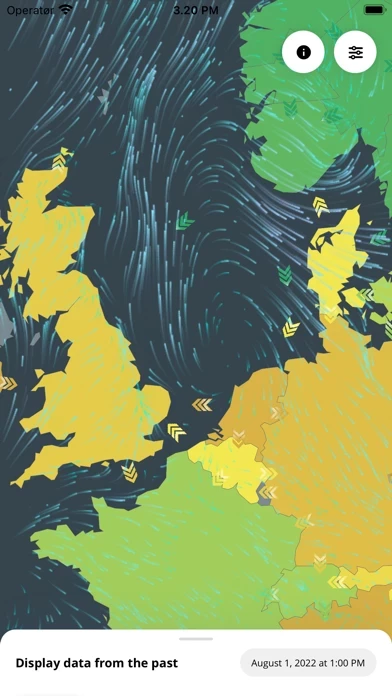
electricityMap is a live visualization of where your electricity comes from and how much CO2 was emitted to produce it.
Captures d'écran officielles
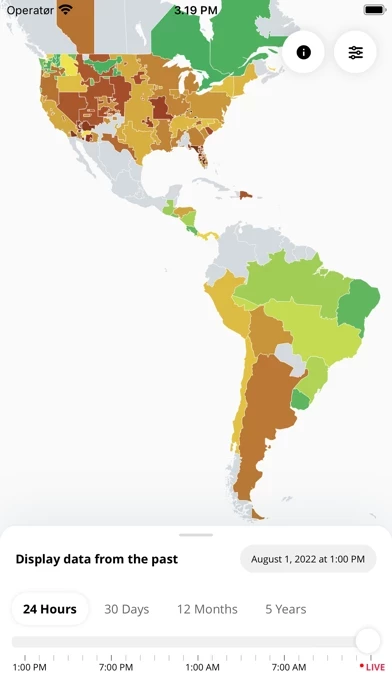

Détails du produit et description de
Electricity Maps is a live visualization of where your electricity comes from and how much CO2 was emitted to produce it.
Haut Avis
Par AnouarAmbroise
Bug et performance à revoir
Je trouve qu’il y a eu beaucoup de régression. La lenteur est manifeste quand on veut changer Léa heures dans la barre du temps. Ensuite le détail de chaque filière ne disparaît plus de la page bref beaucoup de bug dommage car l’intérêt de cette application est évident