Fibonacci Stock Chart Avis
Publié par Mobile Interactive LLC on 2016-11-23🏷️ À propos: Fibonacci is very powerful. Traders never forget to check Fibonacci retracement chart before any swing trade.

🏷️ À propos: Fibonacci is very powerful. Traders never forget to check Fibonacci retracement chart before any swing trade.


Fibonacci Stock Chart - trading signal in stocks est très sûre à utiliser.
Score de sécurité JustUseApp pour Fibonacci Stock Chart : 68.5/100.
Cette évaluation se base sur notre analyse NLP de 1 avis d’utilisateurs.
Combinée à la note moyenne du store de 1.0/5.
Fibonacci Stock Chart - trading signal in stocks semble authentique et fiable.
Nos modèles NLP estiment la fiabilité. Score de fiabilité JustUseApp pour Fibonacci Stock Chart est 68.5/100.
Cette conclusion se fonde sur l'analyse de 1 avis d’utilisateurs.
**Les données de tarification sont basées sur les prix d'abonnement moyens indiqués par les utilisateurs de Justuseapp.com..
| Forfaits tarifaires | Montant (USD) |
|---|---|
| Upgrade to Full Version | $9.99 |
The powerful watch-lists allow to group contents into Charted Sector View and exhibit a LIST of fully customized Charts (Multi-Chart View)! Adjust the technical indicator, chart type, and date range for the Multi Chart View and the app will automatically remember your settings.
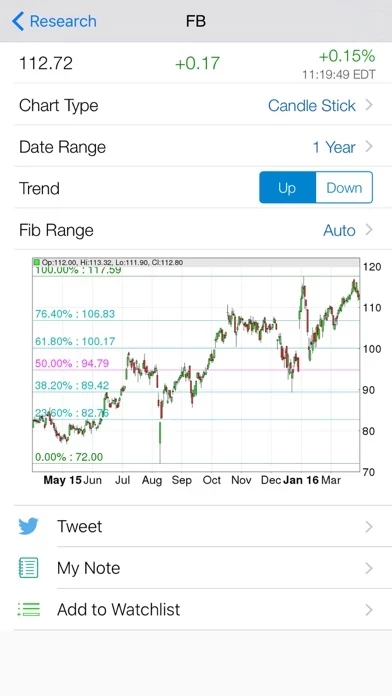
Fibonacci retracement on Stock Chart has never become this easy! Just enter the ticker symbol (or a partial symbol) you desire and bingo! you are there! A neat stock chart with Fibonacci lines and various Chart Types and Date Ranges is specially presented.
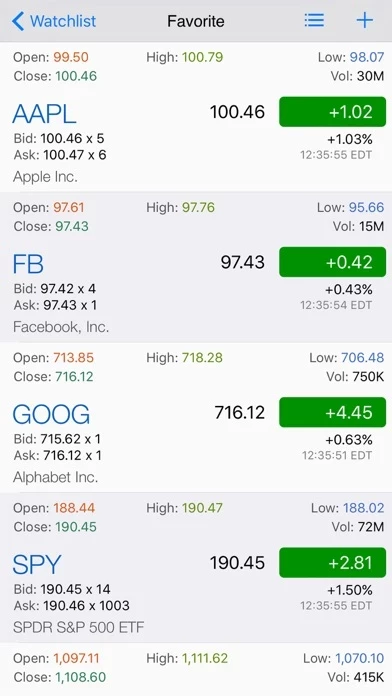
All come with Real Time Advanced quotes (pre and after market quotes included), powerful Multi Chart View & Sector View, customized watch-list, stock notes, etc.
This app is a handy tool to quickly draw the Fibonacci lines on the chart based on the time range and direction (uptrend or downtrend) you choose.
■ Daily chart also supports customized date range: choose any date range from the calendar.