- Wide range of visualization options, including geo-map, pie, donut, bar, stacked bar, line, bar-line combo, funnel, heat-map, web, and more chart types; Pivot tables, summary and tabular views.
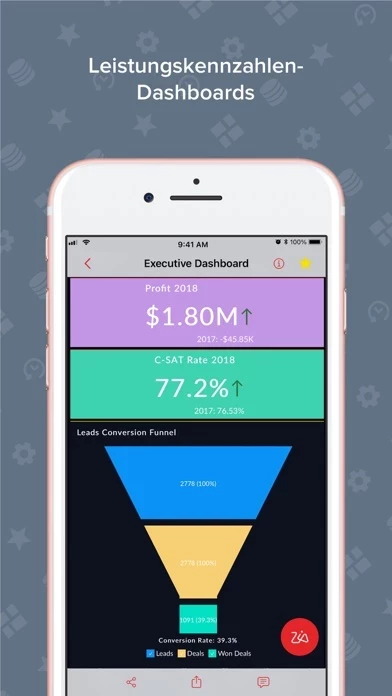
- View single page, at-a-glance dashboards, including KPI dashboards, business dashboards, marketing analytics dashboards, sales analytics dashboards, and more.
- Apply filters and see filtered data.
- See the underlying data, or drill-down any point in the report.
- Segregate reports based on type, folders, and related views.
- Quickly access select reports using Favorites and Recent Items.
- Export and share reports with colleagues and clients, with fine-grained access control. Users can control what the shared user can or can't do, like create reports, view/drill-down the underlying data, export the data/reports, etc.