ReportPlus Data Analytics Overview
Become empowered to easily create, edit and share interactive real-time insights and KPIs providing an effective data-driven approach that every business needs on any platform to stay on top of your organization.
ReportPlus is a true self-service BI tool for your business that allows you to securely access and transform your data to gain new insights and make smarter decisions faster.
• Create interactive charts and dashboards that can be filtered, sorted, drill down into data, link dashboards.
• New to ReportPlus? Download the app, create two free dashboards.
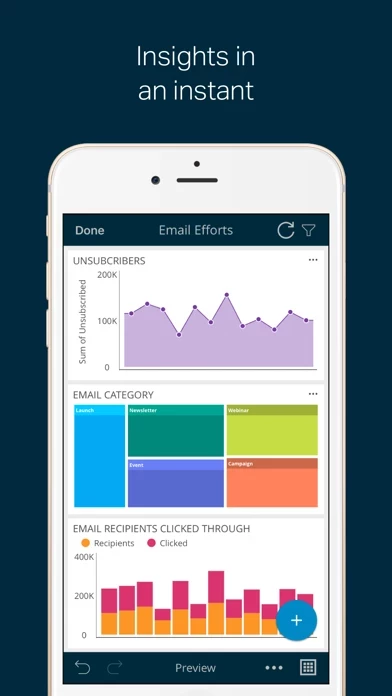
Official Screenshots
Product Details and Description of
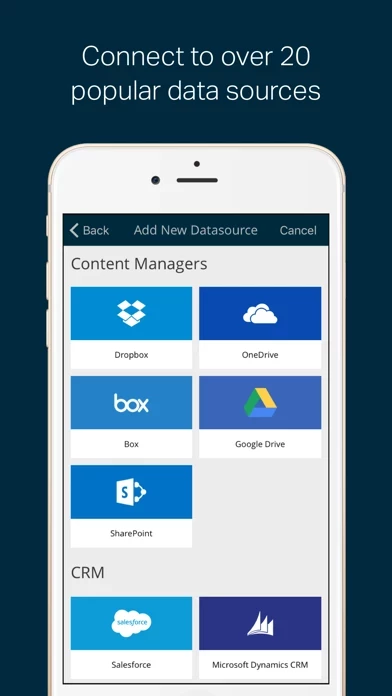
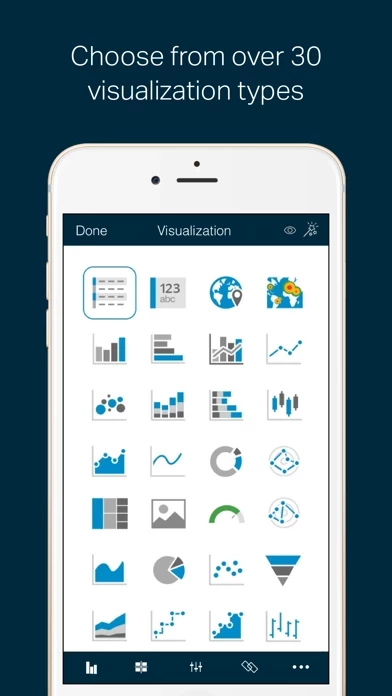
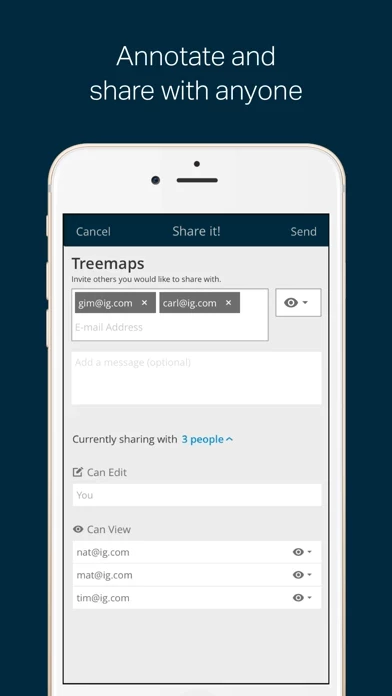
ReportPlus is a true self-service BI tool for your business that allows you to securely access and transform your data to gain new insights and make smarter decisions faster. Become empowered to easily create, edit and share interactive real-time insights and KPIs providing an effective data-driven approach that every business needs on any platform to stay on top of your organization. Highlights: • Stay on top of your organization with real-time insights and KPIs • A familiar drop and drag experience to connect the most popular data sources • Swipe and quickly choose visualization types • Tap a field to set filters • Save your dashboard on premise or in the Cloud • One click to share your story with everyone • Choose from over 30 visualization types to create robust dashboards and quickly style them with preset themes to customize colors and fonts • Connect to today’s most popular data sources Connect to live data: • Spreadsheets: Excel, CSV, Google Sheets. • Content Managers: Dropbox, Google Drive, SharePoint, Box, OneDrive. • CRMs: SalesForce, Microsoft Dynamics CRM. • Datastores: SQL Server, Analysis Services, SSRS, MySQL, Oracle, Sybase, PostgreSQL, Hadoop Hive. • Social: Facebook, Twitter. • Analytics: Google Analytics, appFigures. • Many more: OData service, IMAP Mail Server, User Voice, Web Resource. Combine 2 data sources into one visualization as well! Create anywhere: • Create charts and dashboards on your iPhone, iPad, or desktop computer.* • Choose from 23 different visualization types including bar, column, donut, area, stacked, bubble, and pie charts, maps, tables, KPI gauges, and many more. • Create interactive charts and dashboards that can be filtered, sorted, drill down into data, link dashboards. • Quickly design with over 20 beautiful themes. • Custom SQL queries right from your device. • Bring your own custom visualizations into ReportPlus. Access anytime: • Sync and access your dashboards on your iPhone, iPad, and your desktop computer.* • Secure your data with a passcode. Use TouchID to unlock it. • Get answers without IT, No server side component required. • Work offline. Share with anyone • Invite others and collaborate.* • Email an annotated screenshot. • Nail your next presentation by exporting your dashboards and charts to PPT, PDF, and Word with your branding. • Display dashboards on large screens via Airplay or HDMI. It’s easy to get started • Already use ReportPlus? Download the app for FREE and sign-in with your ReportPlus account. • New to ReportPlus? Download the app, create two free dashboards. No credit card required, and no obligation to purchase. Subscribe The ReportPlus subscription is optional, and the subscription features are available via an auto-renewing subscription. ReportPlus offers a subscription of 1 year for $ 99.99. Payments will be charged to your credit card through your iTunes account after confirmation of purchase. Your subscription will automatically renew unless cancelled at least 24-hours before the end of the current period. Your subscription can be managed in your iTunes Account Settings after purchase. Subscriptions cannot be cancelled for the current active period. To learn about our privacy policy visit: http://www.infragistics.com/legal/privacy For the Terms of Use visit: https://www.infragistics.com/legal/terms-of-use *Available with a subscription.
Top Reviews
By HotSnapZcom
Awesome App - a few minor bugs
Currently using free version and am using this to access a ShipWorks SQL database remotely using OpenVPN. Am on the verge of subscribing it is that impressive so far. Why this great app doesn’t have more reviews, I’m not sure. Before I critique few bugS, please understand I recommend trying this program out. Quite powerful and sophisticated for iOS App IMO. BUGS so far: There are some things to be aware of when working with a larger DB. There is a 200K limit, so it is best to HIDE ALL fields, then make your needed fields visible. The app defaults to all fields being visible which created some issues showing data until I figured it out. Also using some sort of Sort field, like Date, then SETTING A shorter time period also got data under 200k record limit. Couple of glitches occur sometimes when switching between different graphs, where nothing is displayed. Be sure to hit the # area of the pivot table to switch views between table and graph. Also, resizing field columns does not always seem to remain where I set them. Overall a great app with a bit of a learning curve to figure out and also knowing how to connect to your DB is required.
By WinksVille717
Works for me
Works as indicated and user friendly
By Ashleytooth
bee pig
Cool!